
Performance analytics
Your edge, measured.
Win rate is a vanity metric. Premo shows the numbers that decide whether you have an edge - expectancy, drawdown, how much of each move you keep, and where your entries actually pay.
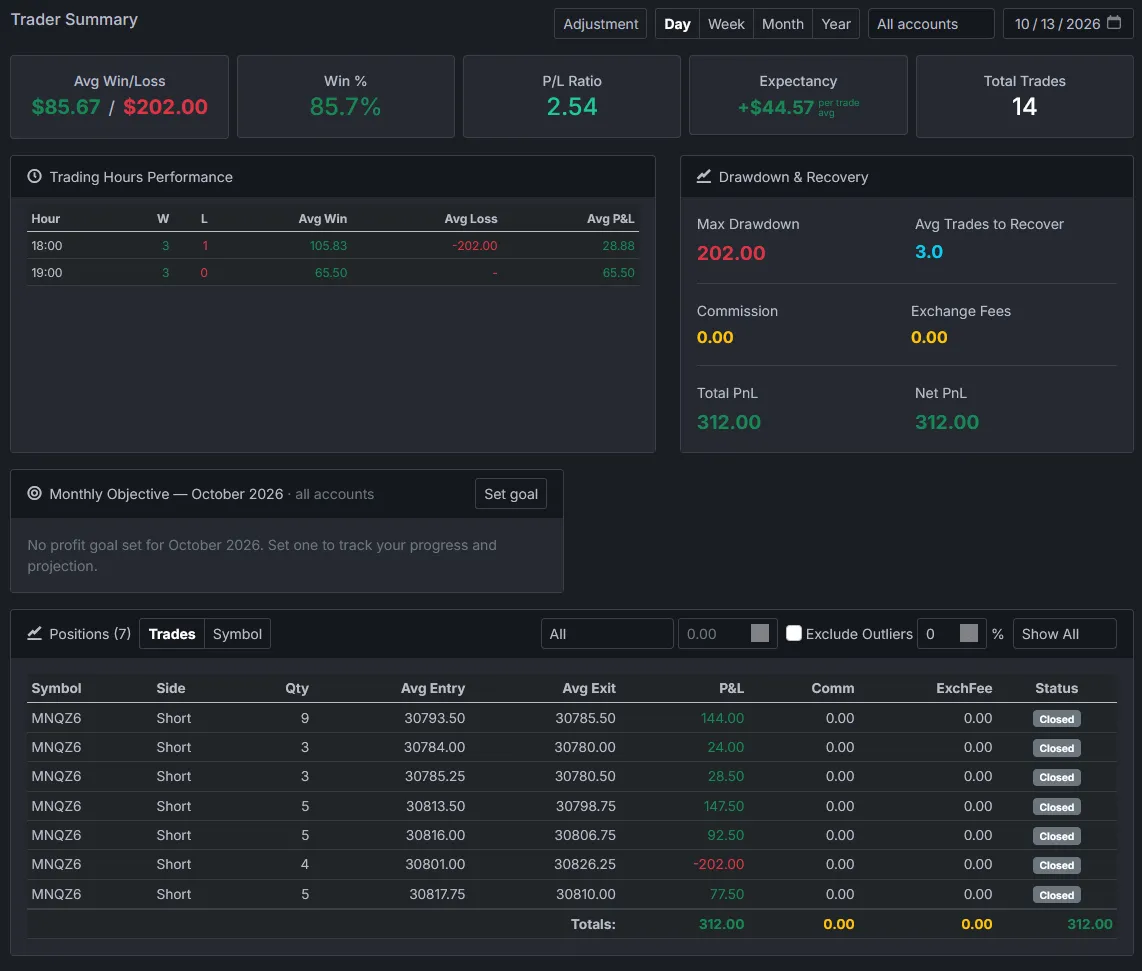
The headline numbers
Four numbers. One answer.
Calculated from every closed position, for any day, week, month or year - and any account.
-
Win %
winners / closed tradesHow often you are right. On its own, it says nothing about whether you make money.
-
Avg win / avg loss
mean P&L of winners and of losersWhat being right and being wrong are each worth.
-
P/L ratio
avg win / avg lossYour reward to risk. A 40% win rate is fine at 2:1.
-
Expectancy
(win % × avg win) − (loss % × avg loss)What you make, on average, every time you click buy or sell. The one number that decides if you have an edge.
Risk
Drawdown and recovery
How deep do your losing streaks go, and how long does it take to climb back out? Max drawdown and average trades-to-recover tell you whether your size fits your strategy - and fees are counted, so net P&L is what you actually kept.
- Max drawdown - the deepest peak-to-trough drop in the period
- Avg trades to recover - how many trades a drawdown costs you
- Commission and exchange fees - accumulated per position
- Total vs net P&L - before and after every fee
Excursion analysis
How much of the move did you keep?
For every closed trade, Premo reads the price bars between entry and exit to find the maximum favourable excursion (MFE) and the maximum adverse excursion (MAE).
-
Efficiency
Realized P&L as a share of the best price you were offered. Low efficiency means you're leaving the move on the table.
-
Clean winners
Winners that never went against you by more than a quarter of their best move. A high rate means your entries are sharp.
-
Scratchable losers
Losers that went your way by at least half their worst drawdown first. Those are the trades a better stop or break-even rule would have saved.
-
Median MFE, MAE and symmetry
How far trades typically run for you and against you - the starting point for setting stops and targets from your own data.
Trade shape
The habits hiding in your hold times
Medians, not averages - so one big day can't hide what a normal trade looks like.
-
Winners vs losers: hold time
Median minutes in winners against median minutes in losers. Holding losers longer than winners is a classic leak - now you can see whether you do it.
-
Time to fail
The share of losses that closed quickly. A good stop fails fast; a hopeful one doesn't.
-
Median win and median loss
In dollars and in price move - what a typical winner and loser really are, without the outliers.
-
Big-win and small-loss rates
How often you let a winner run, and how often you keep a loser small. Both are skills you can track.
Entry-price heatmap
Where your entries actually pay
For any symbol, your trades are grouped into entry-price bands and coloured by total P&L. Bands with enough trades are labelled favourable or unfavourable - with today's price marked, so you know which zone you're in before you click.
- Green bands - prices where you've made money
- Red bands - prices where you keep giving it back
- Current price - overlaid, so the history is actionable today
Go deeper
Every symbol has its own edge
Open any symbol and every number on this page is recalculated for it alone - KPIs, hourly performance, positions, excursions and the heatmap.
FAQ
Analytics questions
Where do MFE and MAE come from?
From the price bars during each trade. For every closed position, Premo looks at how far price moved in your favour and against you between entry and exit. Each result shows how many trades had full bar coverage.
Can I analyse one symbol on its own?
Yes. The symbol view repeats every statistic for a single symbol - win rate, expectancy, hourly performance, positions, excursions and the entry-price heatmap - for any day, week, month or year.
Do outliers distort the numbers?
They can, which is why you can exclude the top and bottom X% of winners and losers from any view and watch every statistic recalculate.
Are fees included?
Yes. Commissions and exchange fees are accumulated per position, and net P&L is shown after all of them.