
Trade journal
The journal that does the bookkeeping - and tells you the truth.
Import your fills and get positions, statistics, hourly performance and monthly goals, automatically. Then see how your mindset moves your P&L.
Journal plan from $15.99/month billed yearly, or $19.99 monthly.
Import
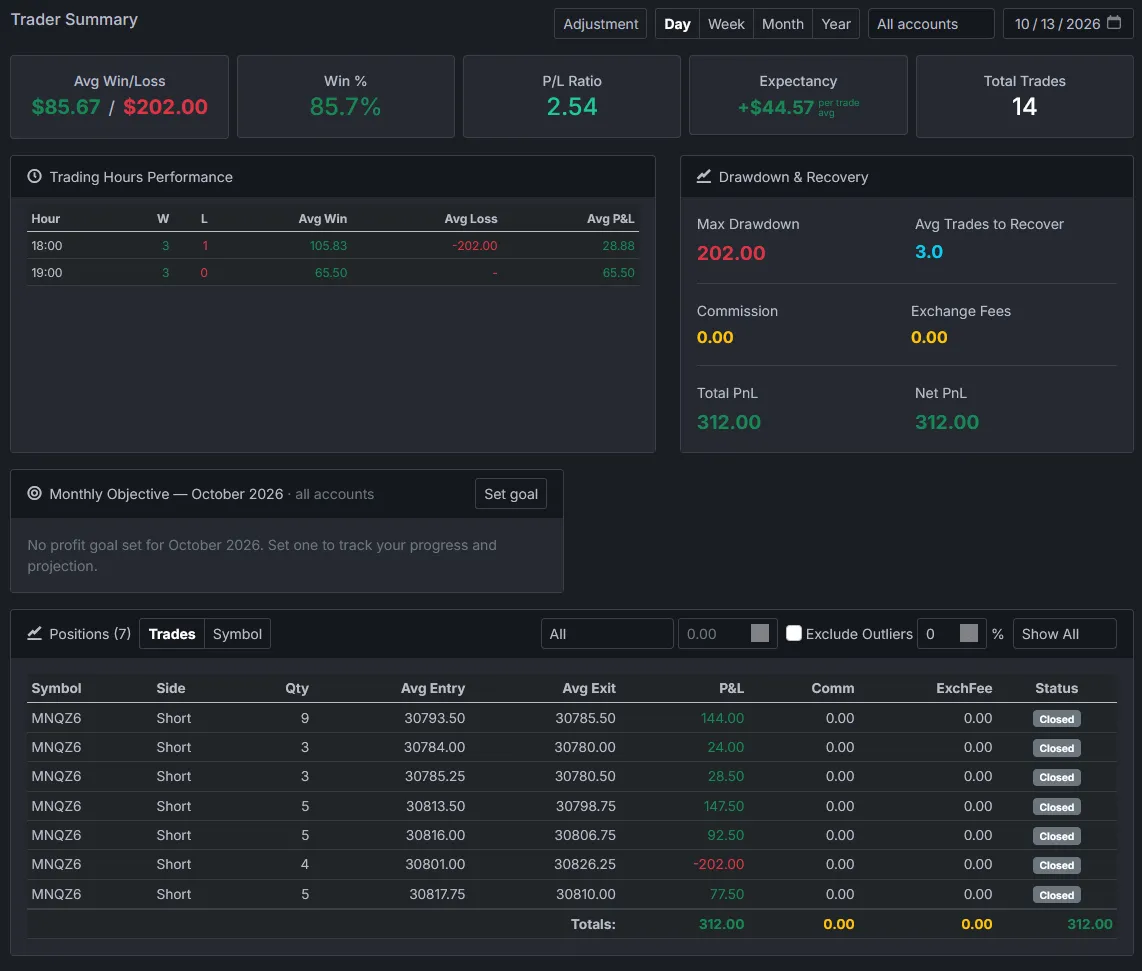
Your fills, rebuilt into positions
Drop in a CSV and every fill is grouped into positions with weighted-average entry and exit, commissions and exchange fees included. No spreadsheets, no manual entry.
- CSV import from your trading platform - new platforms added on request
- Weighted-average entries and exits across scale-ins and scale-outs
- Open positions carry over between days with their fees
- Manual adjustments for anything the broker file misses
- View by trade, or roll up by symbol
Statistics
The numbers that decide whether you have an edge
Calculated from every closed position, for a day, week, month or year.
-
Win rate
Share of closed positions that made money.
-
Avg win / avg loss
What a typical winner and a typical loser are worth.
-
P/L ratio
Average win divided by average loss - your reward to risk.
-
Expectancy
What you make, on average, every time you take a trade.
-
Max drawdown
The deepest peak-to-trough drop in the period.
-
Trades to recover
How many trades it takes, on average, to climb out of a drawdown.
-
Commissions & fees
Commission and exchange fees, accumulated per position.
-
Net P&L
What you actually kept, after every fee.
Account aggregation
Every account, one view - or each on its own
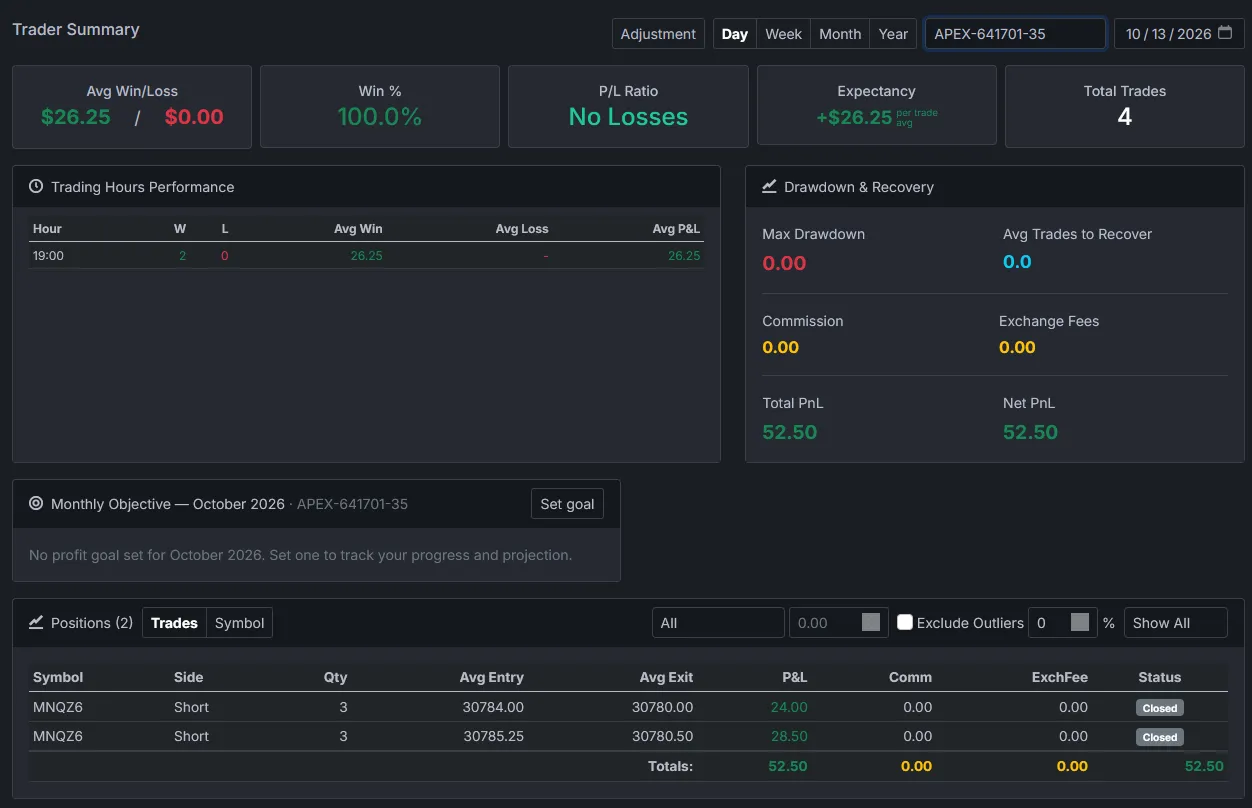
Trade a prop evaluation, a funded account and a personal account? See them all together, or pick one and every statistic, table and goal follows.
- All accounts combined, or any single account
- Day, week, month and year views
- Account names come from the file, or you set them on import
- Monthly objectives per account, or across all of them
Hourly stats
Find the hours that pay - and the ones that don't
Every hour you trade gets its own wins, losses, average win, average loss and average P&L. If one hour keeps giving back what the rest of the day made, you'll see it here.
- Wins and losses per hour of the day
- Average win, average loss and average P&L per hour
- Spot the overtrading hour - then stop trading it
Outlier analysis
Base hits or home runs?
Trim the tails of your P&L curve and find out whether your edge is a repeatable process - or a couple of lucky days.
Exclude the top and bottom X%
Set a percentage and Premo removes that share of your biggest winners and your biggest losers, then recalculates every statistic on what's left: win rate, expectancy, P/L ratio and net P&L.
- Edge holds Your results come from base hits - a process you can repeat and size up.
- Edge disappears You're relying on home runs. One missed runner and the month goes red.
- Edge improves A few blow-ups are erasing a good process. Fix the stop, not the strategy.
Pair it with P&L filters - above, below or between any amount - to study exactly the trades you care about. Nothing is deleted; it's a lens, not an edit.
Monthly objectives
Set the goal. See exactly what it takes.
Set a monthly profit goal for one account or all of them. Premo tracks your realized P&L against it, projects where the month will finish, and tells you what your win rate, reward-to-risk and expectancy need to be for the rest of the month to get there.
- Achieved Goal reached.
- Ahead Projected to finish above the goal.
- On track Pace matches the goal.
- Behind Below pace - the required stats show the gap.
- Off target Not reachable at the current pace. Time to protect the month.
| Stat | Current | Required |
|---|---|---|
| Win rate | 58.7% | 63.0% |
| R:R (avg win / avg loss) | 1.42 | 1.61 |
| Expectancy / trade | 46.74 | 66.07 |
P&L psychology
Your state of mind is a position. Track it.
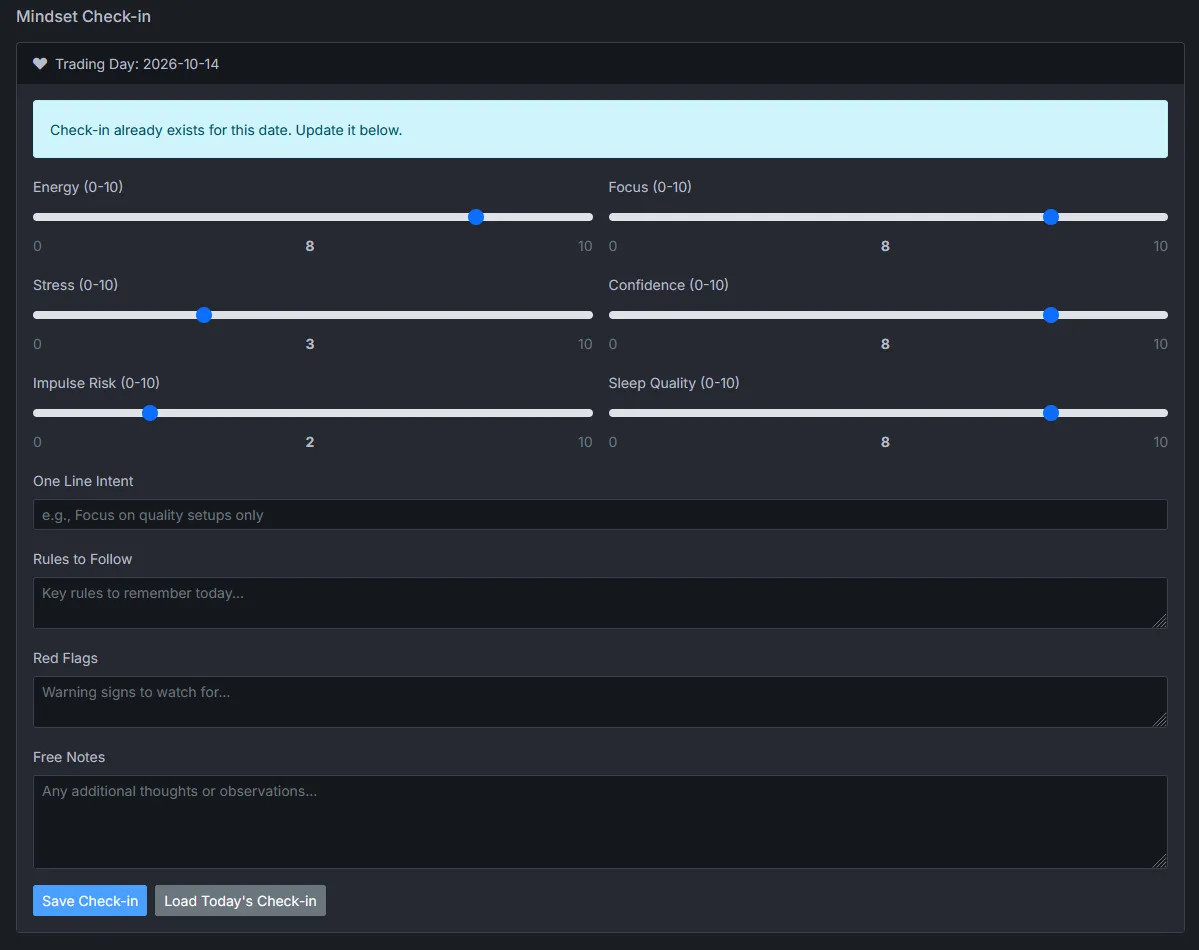
A quick check-in before the open. Over time, Premo lines it up against your results and shows which conditions come before your best - and worst - days.
Before the open
Score your energy, focus, stress, confidence, impulse risk and sleep from 0 to 10. Write a one-line intent, the rules you'll follow and the red flags to watch for.
After the close
Psychology ↔ Performance correlates each score with your daily P&L and win rate, and compares your average P&L on high days against low days. Findings are tagged so you know what to do with them:
- Edge Higher sleep quality lines up with better P&L - protect it.
- Risk High impulse-risk days cost you money - trade smaller on them.
- Watch Overconfidence warning - your most confident days are not your best ones.
Example insights. Each real insight shows the number of days it's based on.
Journal plan
Everything on this page, one plan.
$15.99/month billed yearly (save 20%), or $19.99 month to month. Cancel anytime.
FAQ
Journal questions
Which brokers can I import from?
Import a CSV export from your trading platform. TradeZero and TradingView (AMP, Tradovate) are ready today, and we add new platforms on request - just tell us which one you use.
Does excluding outliers delete trades?
No. It is a view, not an edit. The excluded positions are hidden from the stats while the setting is on, and come back the moment you turn it off.
What happens to positions held overnight?
Open positions carry over between trading days, keeping their entry time, weighted-average price and accumulated fees until they are closed.
Can I keep prop-firm and personal accounts separate?
Yes. Every stat can be filtered to one account or shown across all of them. Monthly objectives can be set per account or for all accounts together.
How much history do the psychology insights need?
They appear once you have check-ins and closed trades on at least a few of the same days, and they get more reliable as the sample grows. Each insight shows how many days it is based on.